Inefficient database queries can get the job done for a while but they are bound to impact performance as the dataset grows. At PeekVision we recently suffered performance degradation in some of our environments due to concurrent inefficient queries. At some point even bringing down the whole system. Here is how we identified the inefficient queries and optimized them to improve performance.

The inefficient queries
Thanks to the server logs we quickly identified the source of the inefficient queries: a dashboard page that displays aggregated activity data. This dashboard works acceptably well in most of our environments and, for years, it worked well in the environments that were later effected by the performance degradation. Where were the performance issues coming from then?
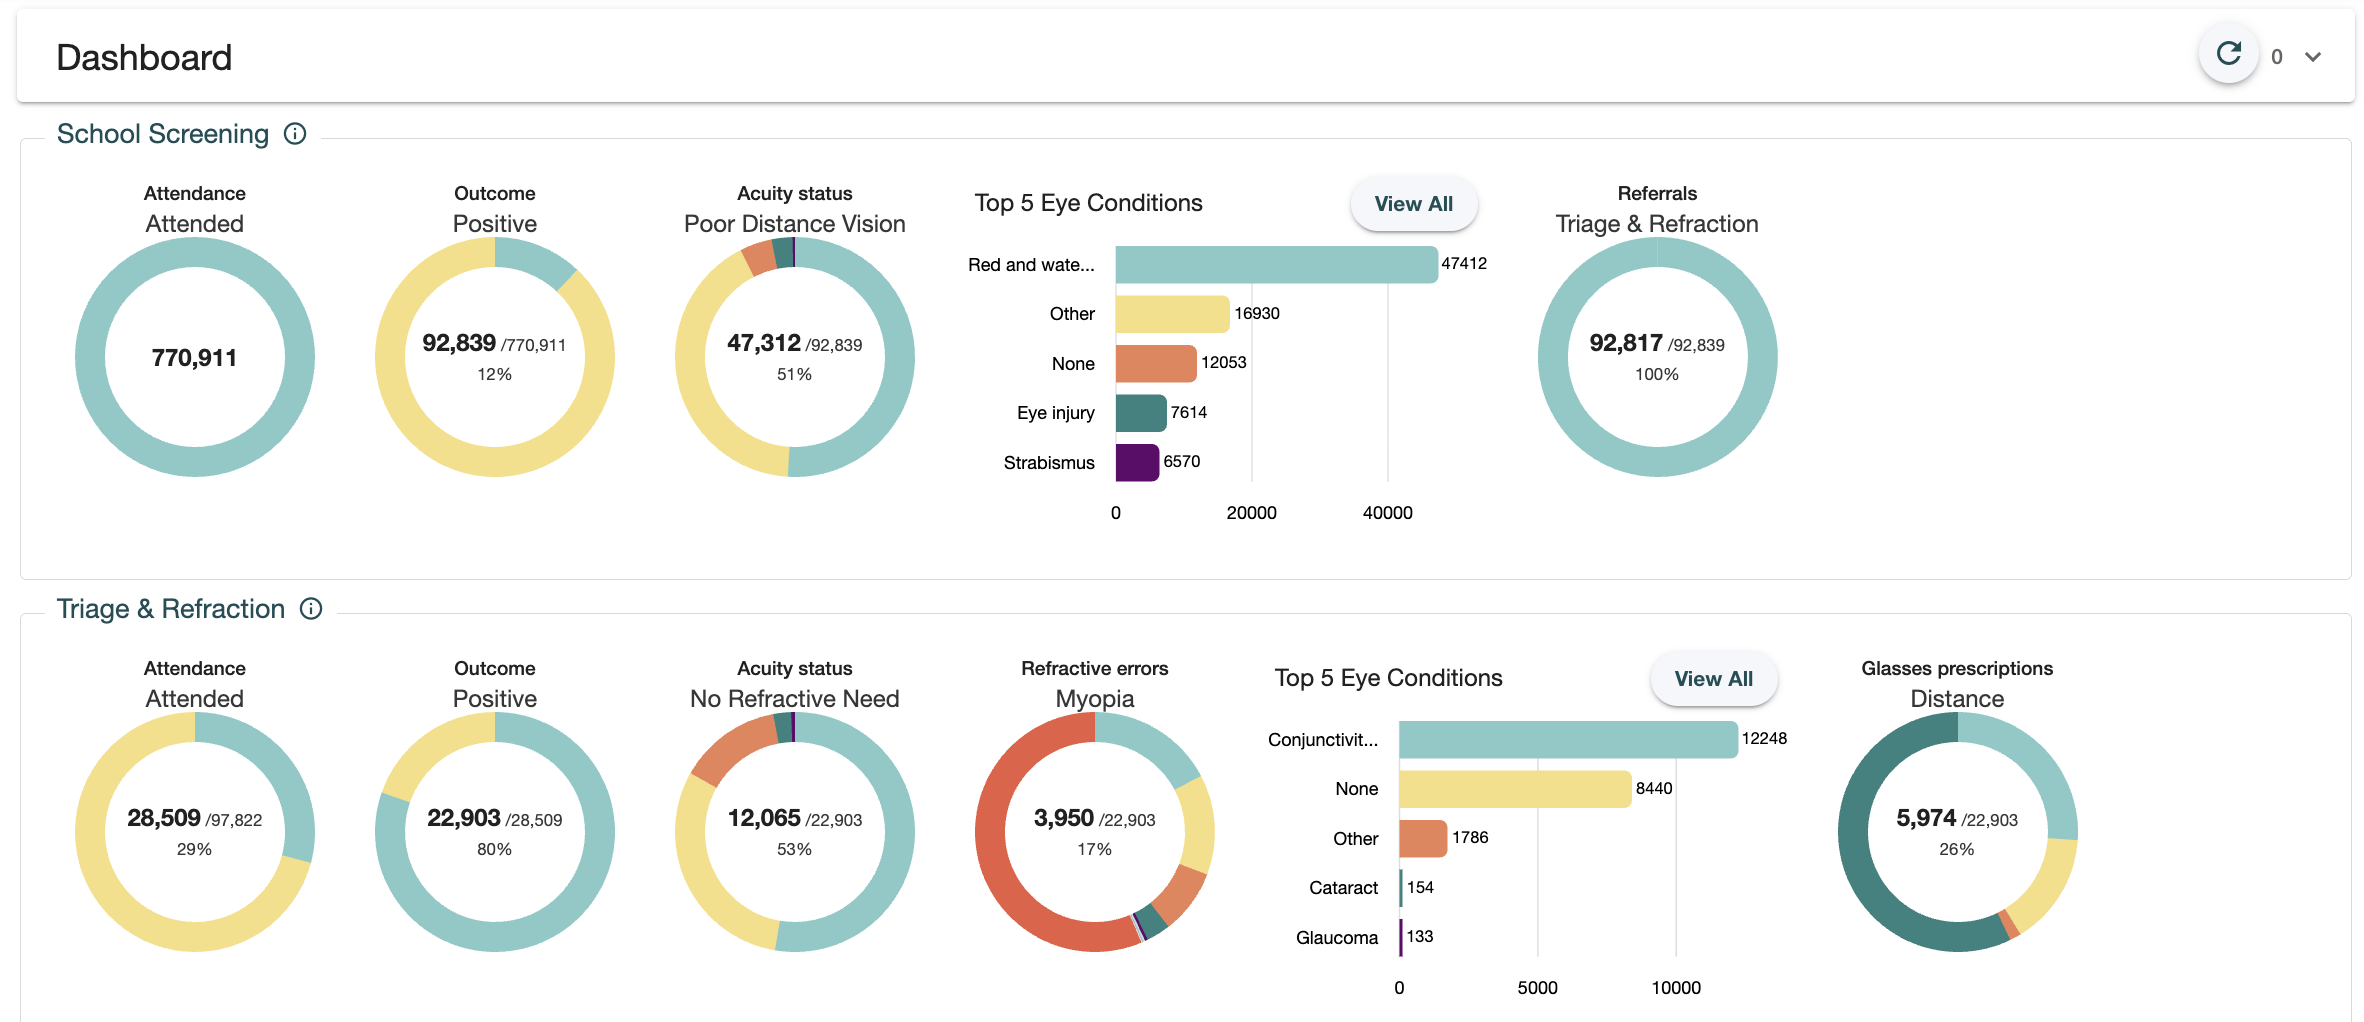
This dashboard displays several stages which are customizable by the user. Each stage displays several dials at its turn and each dial requires one or more queries to fetch the necessary data. When the page was designed we assumed that 3 or 4 stages would be plenty for most users. Some of them however, hungry for insights about their activities, started adding more stages to the dashboard. Up to 13 stages in the worst case, which elevated the number of queries up to 150.
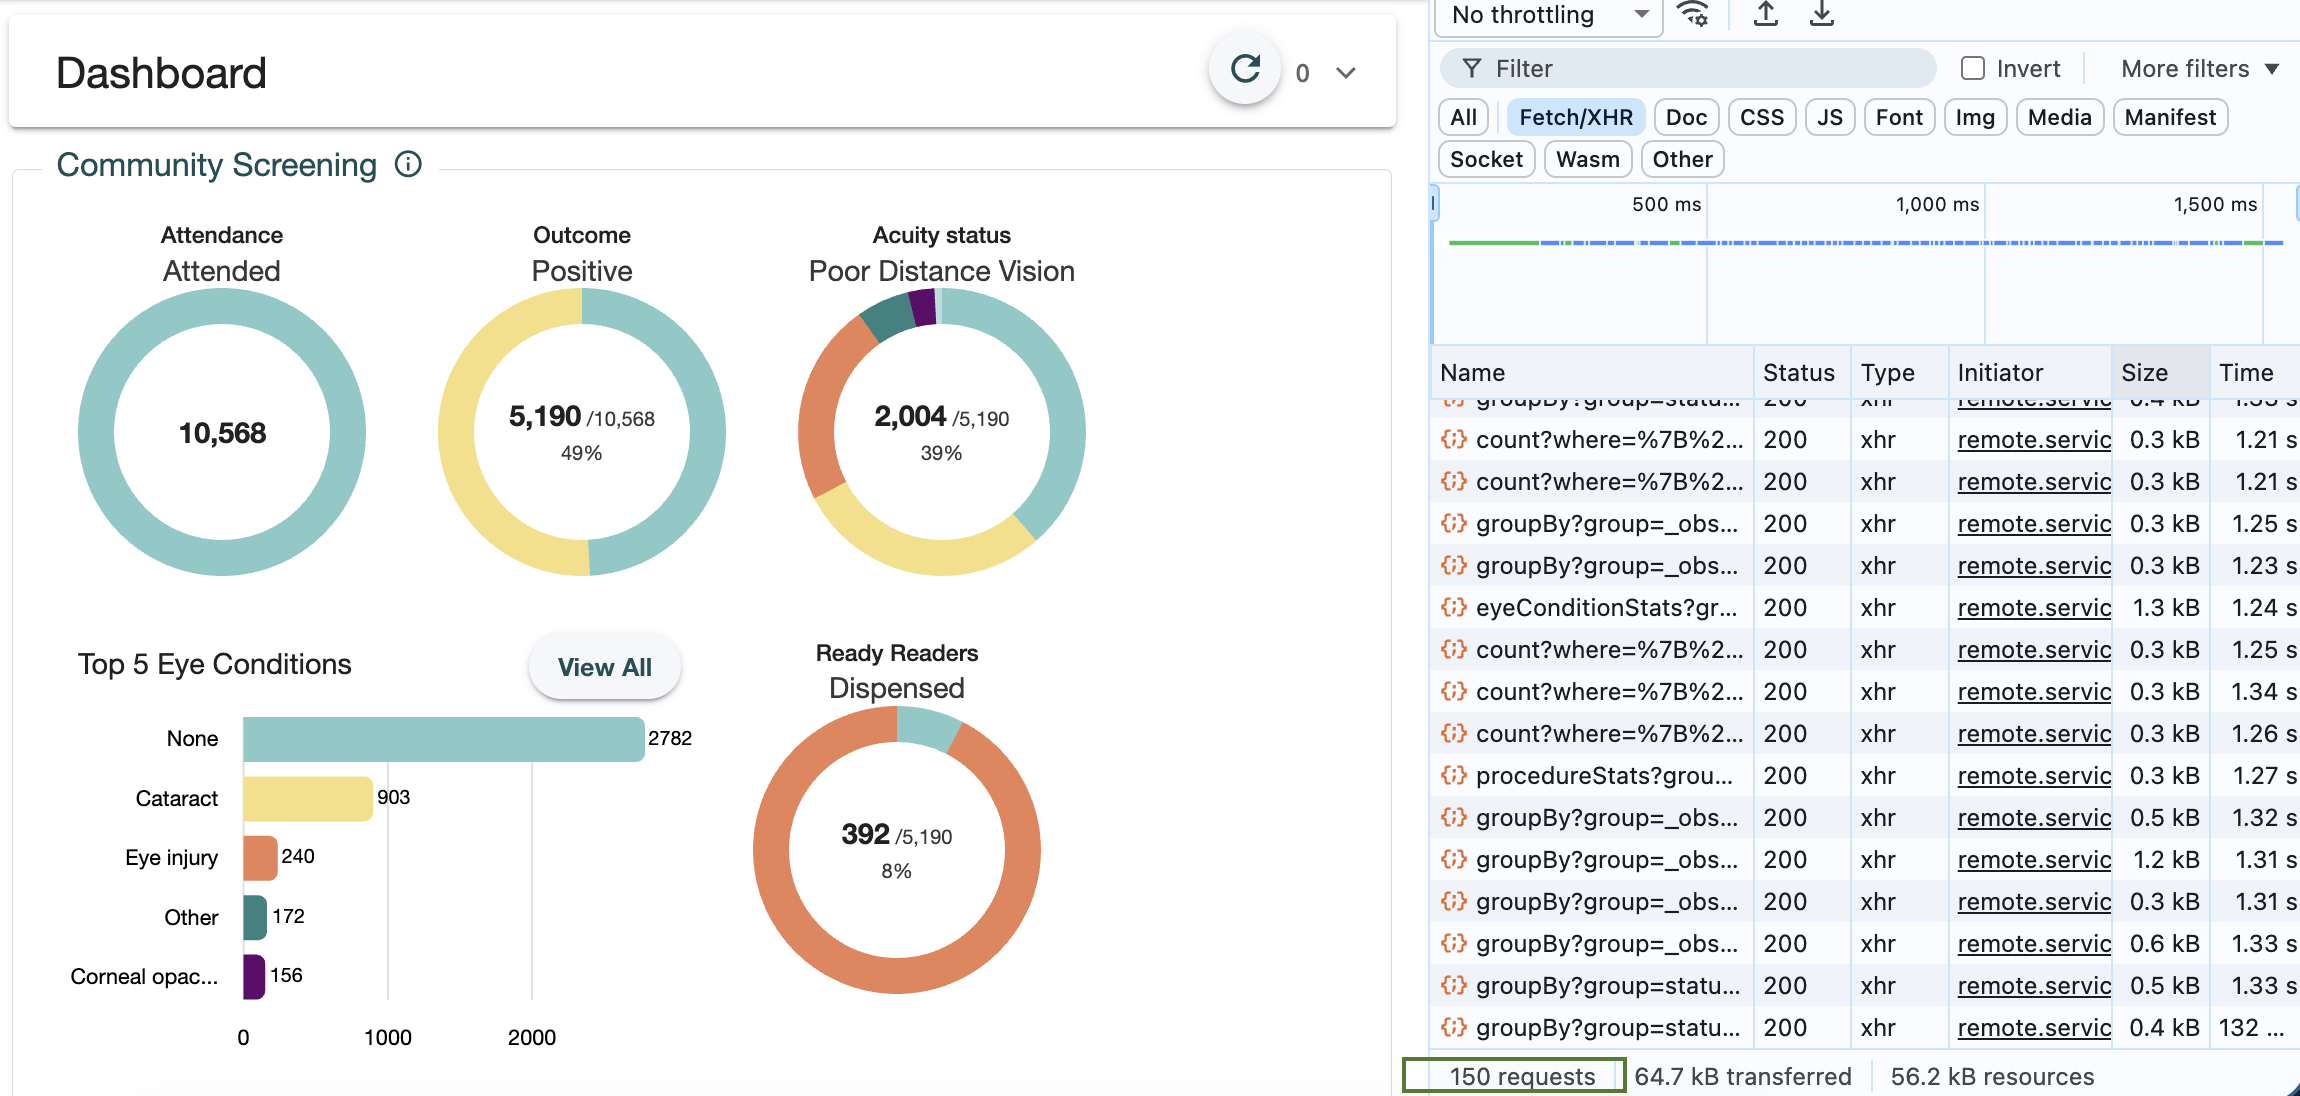
The big number of queries combined with the growing size of the dataset was the perfect storm for performance degradation. The dashboard page was running 150 queries in parallel, each of them taking more time to complete as the dataset grew. This was placing significant stress on the mongoDB server, increasing the memory consumption so much, that the rest of the system was struggling to operate.
Design flaws
Database aside, the dashboard page had a couple of issues that contributed to the bad performance. The degradation episodes brought our attention to them and we had to iron them out before digging into the database queries themselves. Here are a few issues we identified and fixed:
- Duplicate loading. Our dashboard allows filtering the dataset by several criteria and it persists the filters via URL query parameters. We discovered we had a bug in the way we retrieve the filters from the URL query parameters, causing the dashboard to be loaded twice every time the filters were changed. Fixing that 2-line bug alone brought down the number of queries to the half.
- Parallel requests. The dashboard was designed to perform all the Http requests in parallel and display the entire dashboard at once when all the data was loaded. We changed the dashboard to stagger the queries, launching all the queries of a given stage in parallel, but waiting for them to complete before launching the next batch. This makes the complete page load slightly slower but it also means displaying the first stage faster. In standard screen sizes, most of the stages are not visible without scrolling anyway, so the staggered loading doesn't impact the user experience. It does however significantly reduce the load on the database server.
Concurrent users. The dashboard was most used during field training sessions, where several users were accessing the dashboard at the same time. This was multiplying the number of concurrent queries and putting even more stress on the database server. To leverage those scenarios, we implemented a queuing mechanism using p-queue to limit the number of concurrent queries (see the snippet below). It can result in users getting 504 errors under stress conditions, but it is better to have some users getting errors than the whole system being down.
After these improvements, the dashboard page stopped impacting the performance of the system. The dashboard was still taking a long time to load in environments with large datasets however (e.g. in some environments we have collections with 3 million records). At this point we were determined to get to the bottom of it and optimize the queries for good.
Meet the profiler
Here is where the native MongoDB tooling comes into play. The Database Profiler collects detailed information about database commands and writes the data it collects to the system.profile collection. The profiler is disabled by default and enabling it has an effect on database performance and disk use (see Database Profiler Overhead for more details).
We can enable the profiler either from the application code (see the documentation for your mongoDB driver) or from the mongo shell: db.setProfilingLevel(level, options). Depending on how the profiler is configured the amount of collected data can be overwhelming. Is is worth narrowing down the collected data by using the optional parameters of the profiler.
- level = 0. The profiler is off and does not collect any data
- level = 1. The profiler collects data for operations that exceed the options.slowms threshold or match a specified options.filter.
- level = 2. The profiler collects data for all operations, ignoring user provided values for options.slowms and options.filter.
If you haven't identified the collection your inefficient queries are targeting you can focus on slow operations that exceed a certain number of milliseconds. If you have identified the collection your best option is to focus on the operations for that specific collection. It is a good idea to clean previous profiling data before enabling the profiler by dropping the system.profile collection.
// Profile only slow operations
db.setProfilingLevel(1, { slowms: <threshold> });
// Profile only operations for a specific collection
db.setProfilingLevel(1, { filter: { ns: 'yourCollectionName' } });
Once the profiler is enabled we will execute the queries we are trying to optimize. In our case, we reloaded the dashboard page several times. This will create several documents in the system.profile collection; see an example below. Once we have enough information we will want to stop the profiler to reduce further noise by setting the level back to 0.
db.system.profile.findOne();
{
"op": "command"
"ns": "peek.Encounter"
"command": {
"aggregate": "Encounter"
"pipeline": [
{
"$match": {
"status": "finished"
"stationName": "School Screening"
"regionIds": "regions"
"healthyEyes": {
"$exists": true
}
}
},
{
"$group": {
"...": "..."
}
},
]
}
"keysExamined": 145935
"docsExamined": 145935
"cursorExhausted": true
"...": "..."
"millis": 169
"planSummary": "IXSCAN { regionIds: 1, stationName: 1, status: 1, readyreaderOrderStatus: 1, patientInteractionDate: 1 }"
}
Optimizing the queries
From here on optimizing is more an art than a science. What ultimately makes the queries slow is having to fetch documents from disk into memory. The docsExamined property tells us how many documents were read from disk. To improve performance we will want to reduce this number when possible.
Conversely, the keysExamined property tells us how many index entries were read. The queries that can filter documents by reading only the index entries are much faster than the queries that need to load the entire document to determine whether it matches the filtering criteria.
In the example above both keysExamined and docsExamined have the same value: almost 150k documents. This told us that the query used an index (otherwise keysExamined would be 0) but it still had to retrieve all the documents that matched the index entries to determine whether they matched the filtering criteria or not. This can happen when there is no index that covers all the properties we are filtering by or when the query planner picks an index that is not the most efficient one. The planSummary property can be useful here. It reveals the command's scan type, which has two possible values:
- COLLSCAN (Collection Scan). Reads every document in the collection sequentially, examining each one to find matches. It becomes exponentially slower as collection size grows
- IXSCAN (Index Scan). Uses indexes to locate documents, reading only relevant index entries and then fetching matching documents
If you observe COLLSCAN operations you can probably benefit from adding indexes on the properties your query is filtering or sorting by. Remember that indexes come at a cost: they consume disk space and they can slow down write operations. It is a good practice to start with a minimal set of indexes and add more as the application evolves.
The plan summary told us the query was indeed using an index (i.e. IXSCAN), but not the one we expected. Our collections have several composite indexes, which our dashboard was supposed to be using, and the query planner was not picking the one that would have covered all the properties we are filtering by. This can be fixed by providing the name of the corresponding index via the hint optional parameter.
Unfortunately though the number of docsExamined remained unchanged 🤯 This led us to more debugging and a second discovery: the usage of $exists in the query filter was preventing the query planner from using the index effectively. Note that we don't observe this issue on find queries that use the same filter, but it turned out to be the case on the aggregate query we use in the dashboard. Following a suggestion from Claude Code, we turned the { healthyEyes: { $exists: true } } clause into { healthyEyes: { $in: [true, false] } }.
{
"$match": {
"status": "finished"
"stationName": "School Screening"
"regionIds": "regions"
"healthyEyes": {
"$in": [
true,
false,
]
}
}
},
{
"$group": {
"...": "..."
}
},
], {
"hint": "regionIds_stationName_status_healthyEyes_patientInteractionDate_index"
});
db.system.profile.findOne();
{
"op": "command"
"ns": "peek.Encounter"
"command": {
"aggregate": "Encounter"
"pipeline": [
{
"$match": {
"status": "finished"
"stationName": "School Screening"
"regionIds": "regions"
"healthyEyes": {
"$in": [
true,
false,
]
}
}
},
{
"$group": {
"...": "..."
}
},
]
"hint": "regionIds_stationName_status_healthyEyes_patientInteractionDate_index"
}
"keysExamined": 145936
"docsExamined": 0
"cursorExhausted": true
"millis": 72
"planSummary": "IXSCAN { regionIds: 1, stationName: 1, status: 1, healthyEyes: 1, patientInteractionDate: 1 }"
}
And there we go! The number of documents read from disk dropped to 0 and that led to a significant reduction in the query execution time: from 169ms to 72ms. This reduction is even more significant when the running against a larger dataset. The same approach helped us improve a bunch of other queries that had similar issues. In a nutshell:
- Make sure there is an index that covers all the properties you are filtering by.
- Make sure the query planner is picking that index.
- Make sure the documents don't need to be loaded into memory after examining the corresponding index entry.
Conclusion and credits
Optimizing the database queries of an application is a permanent process that requires continuous monitoring and adjustment. Knowing the database engine tooling is crucial to understand how the queries are executed. The MongoDB native system.profile collection is a powerful tool and it helps us achieve just that. I will finish this article crediting Francesco Merletti, our technical lead, who led the efforts to optimize the dashboard page and the database queries. It is inspiring to work with such skilled and passionate colleagues!