Imagine playing Blackjack with the pile of cards facing upwards. You would know which card is coming next at any time and you would never bust. You would continue to ask for the next card as long as the resulting hand has a score below 22. You would not win every hand but your odds of winning money in the long run would skyrocket.
Imagine you have a 15. If the next card was a 3, you would hit and turn it to an 18. If the next card was an 8 instead, hitting would make you bust: you would stand and hope the dealer to go bust. In both cases, the dealer might end up with a score higher than yours, but having the information about the next card simplifies your decision making as you no longer need to worry about busting.
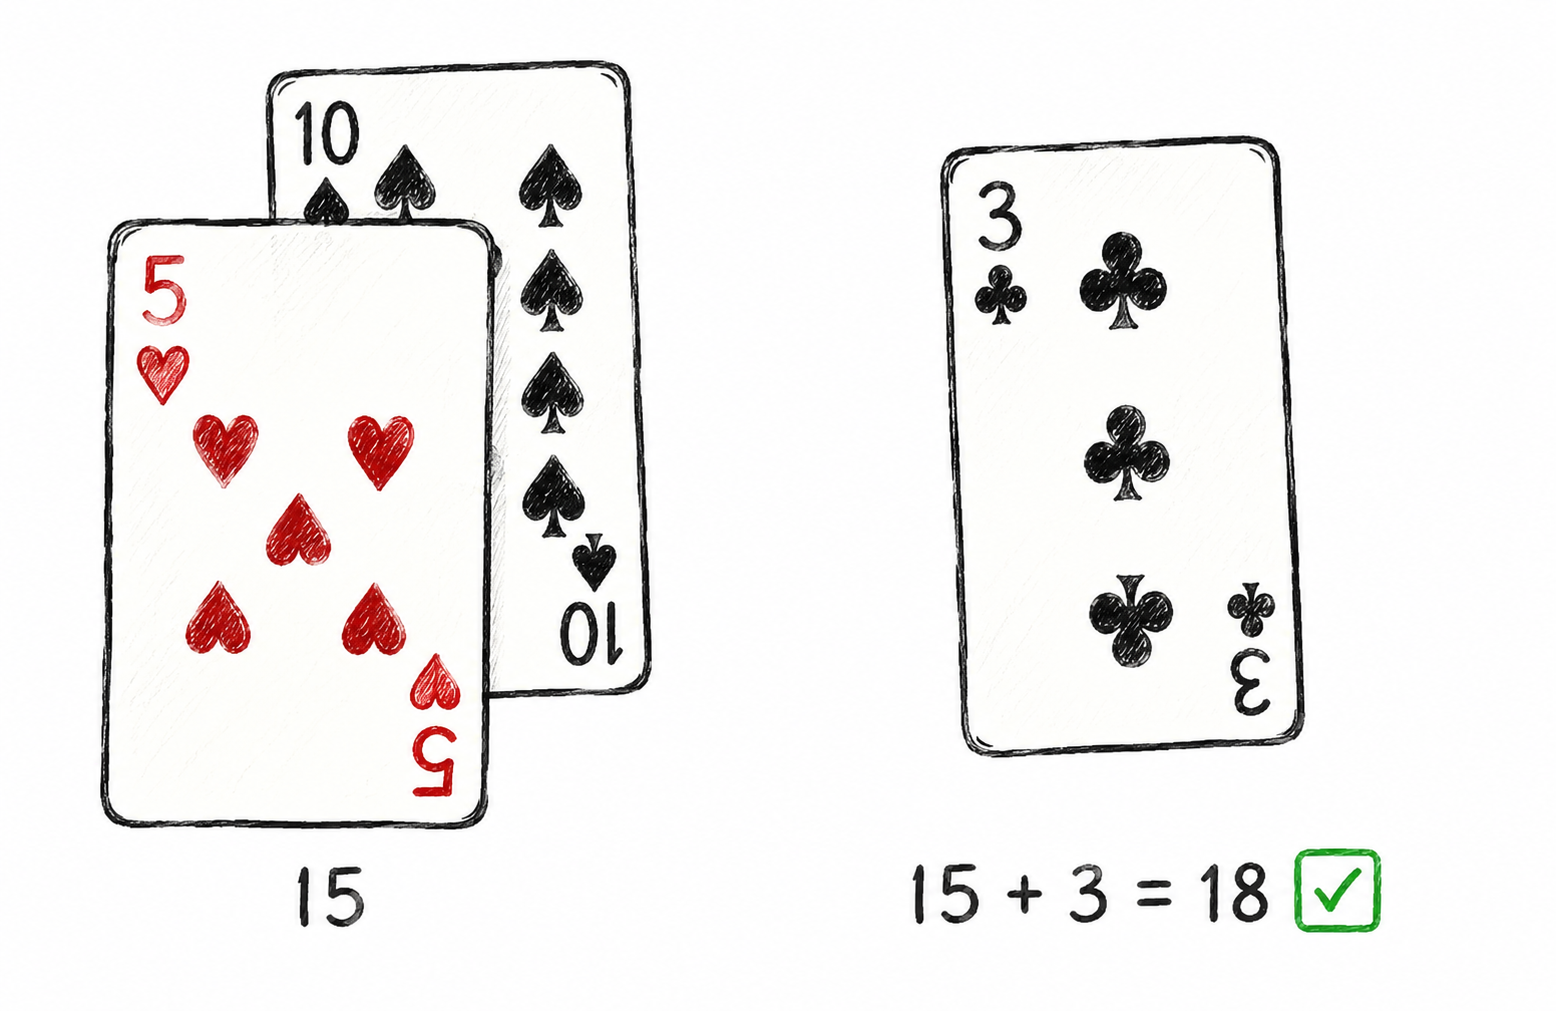
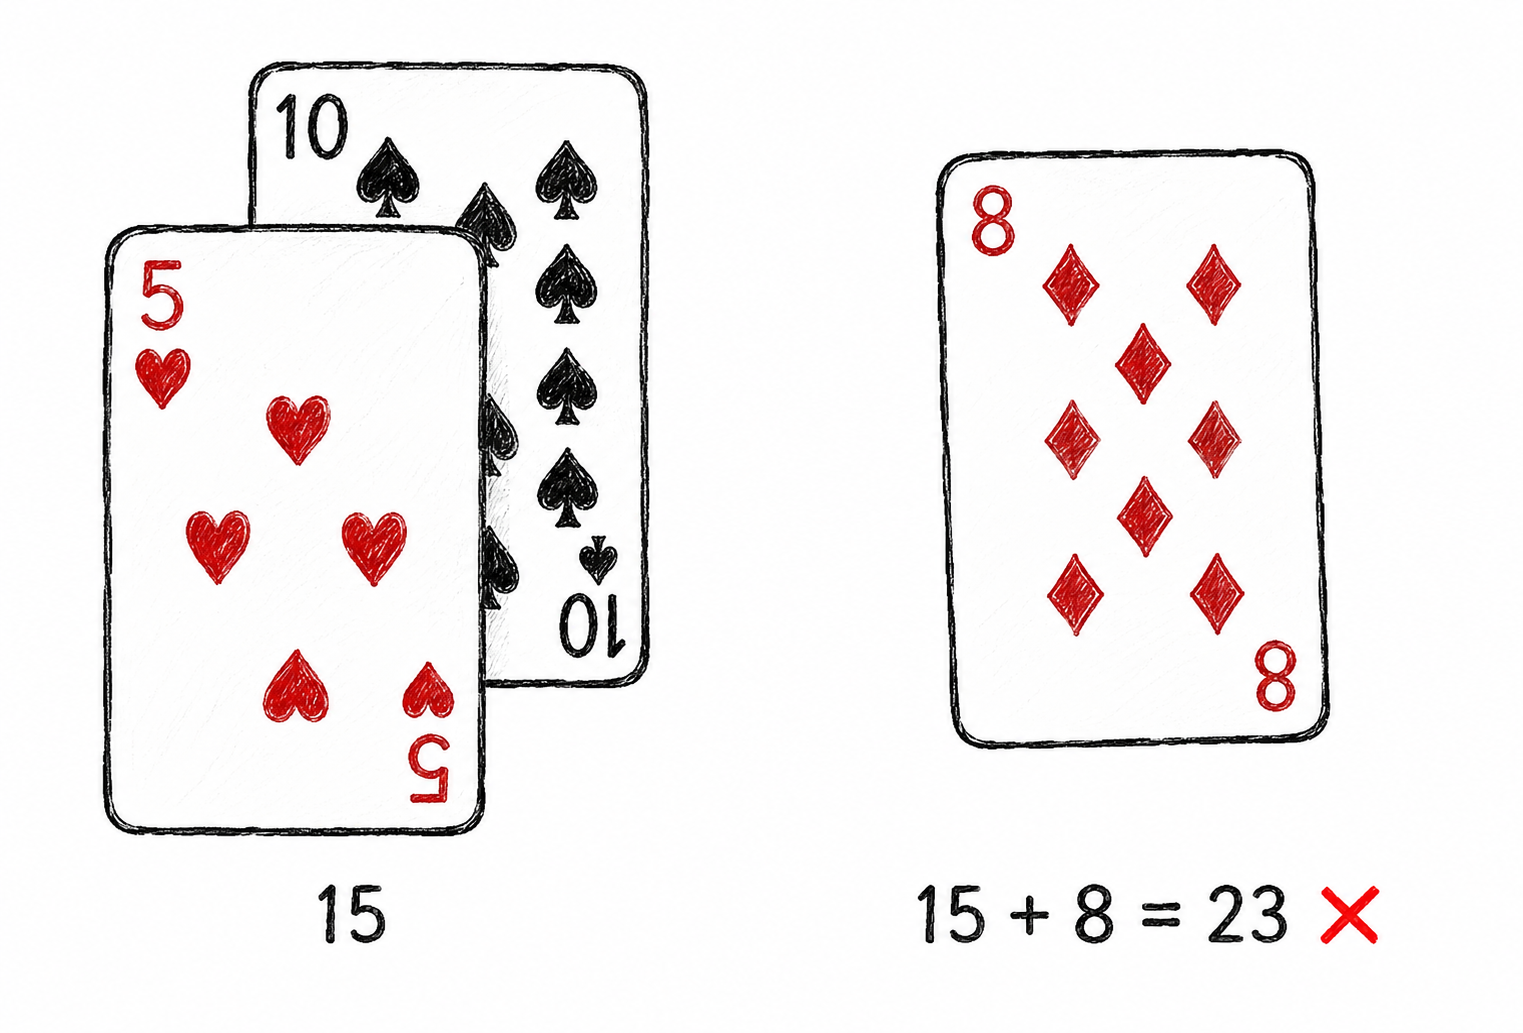
Not many casinos are interested in giving you that much advantage unfortunately. In fact, casinos want you to bust. When both you and the dealer bust, the casino takes your money even before the dealer draws their hand. That's what makes the game profitable for the house. In a fair game, both players being eliminated should result in a draw, right? In the game of Blackjack it doesn't happen this way. Casinos want the certainty they will make money at the end of the day and a perfectly fair game doesn't offer this certainty.
In case you are wondering, the scenario where both the dealer and the player go bust happens more often that you would expect. 1 in approximately every 13 hands for a player copying the dealer strategy (the exact number depends on the player's decision making). We will have a look at where these numbers come from in later chapters of this series.
Casinos keep the pile of cards face down so we have no idea what the next card is and we are forced to make difficult decisions. In these conditions, how can we be sure our decisions are solid? This question has been around for years. Many clever people have thought about it and have come up with different solutions. Edward O. Thorp, for example, ideated a popular solution in 1962: card counting.
Card counting
The idea consists in keeping track of the cards that have been dealt so far to determine which cards remain in the deck. Remembering each and every dealt card is difficult so card counting systems divide cards into categories and assign a value to each category. Players then keep a running count of the values of the dealt cards and they don't need to memorize the exact cards that have been dealt.
The most popular system for card counting is the Hi-Lo system, which divides cards into three categories. Low cards (2, 3, 4, 5, 6), high cards (10, J, Q, K, A) and neutral cards (7, 8, 9). Low cards add 1 to the running count, high cards subtract 1 and neutral cards don't affect the count.
When the running count is positive, it indicates a higher proportion of high cards remaining in the deck, which is favorable for the player. Conversely, a negative running count suggests a higher proportion of low cards, favoring the dealer. It is not a perfect system but it gives the player an edge over the house.
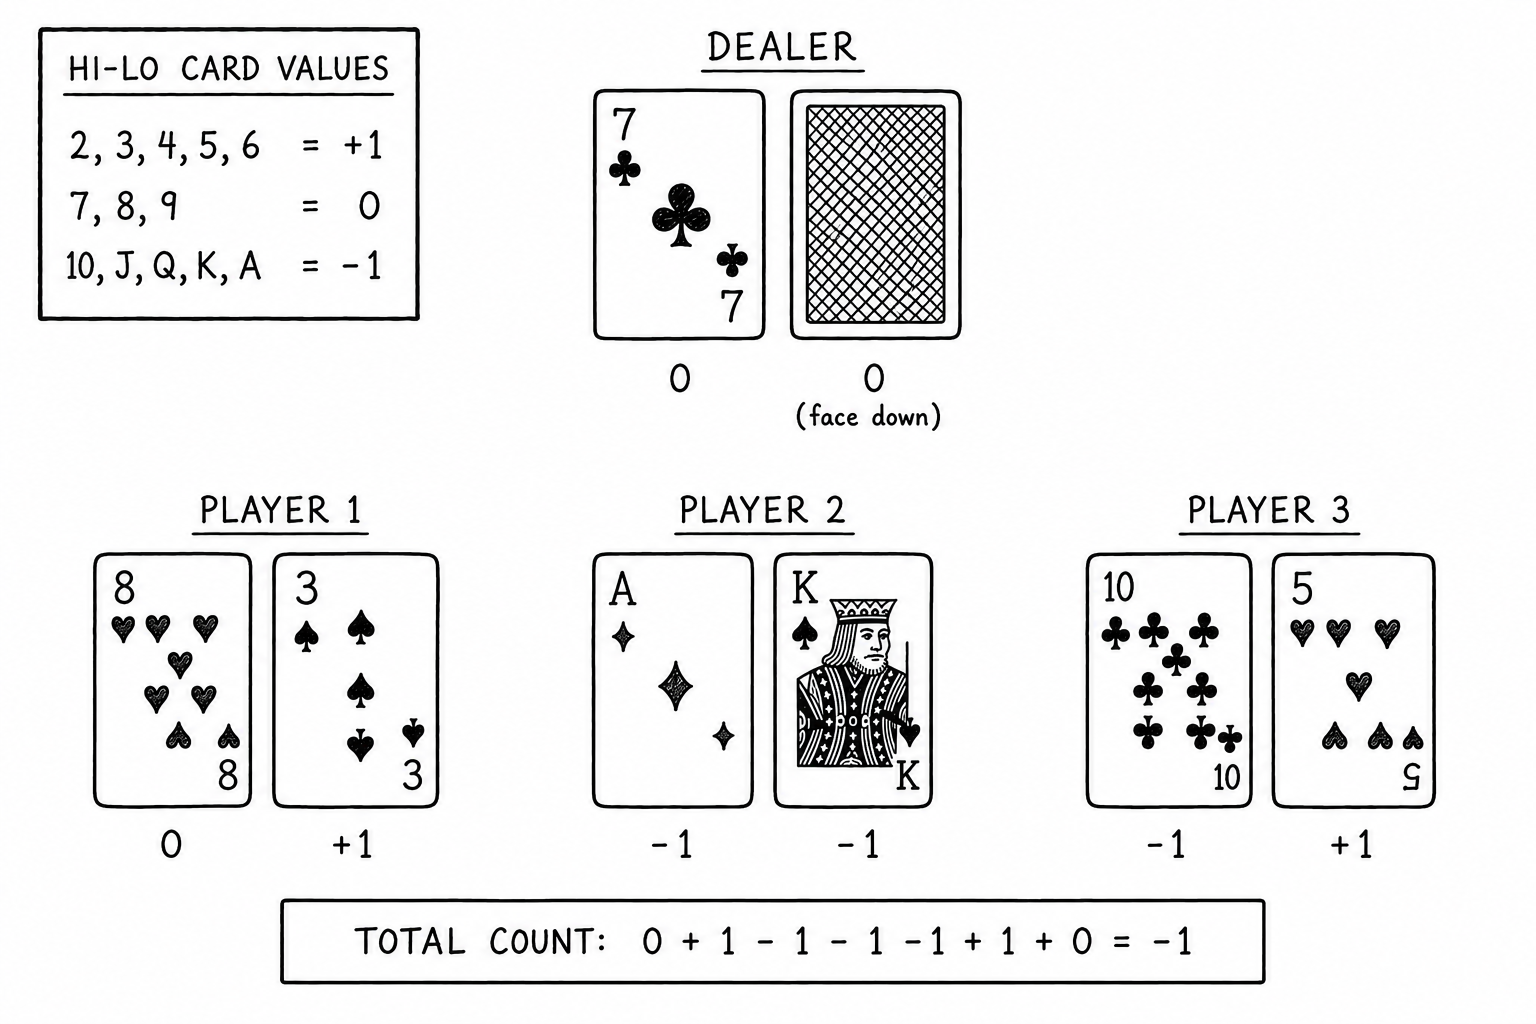
Many people have won considerable amounts of money using card counting: 21 Blackjack is a great movie to daydream of becoming rich by counting cards. Unfortunately, card counting requires serious skills from the player and casinos can take measures against it (e.g. shuffling the dealt cards back to the pile at the end of every game). In practice we cannot rely on it. What other options do we have?
Empirical analysis
Let's run a simple experiment. Set a 15-point hand, deal a card and write down both the dealt card and the resulting score. Then pick the dealt card back and shuffle it into the deck. Repeat this for a large number of times and you will end up with a list similar to the one below.
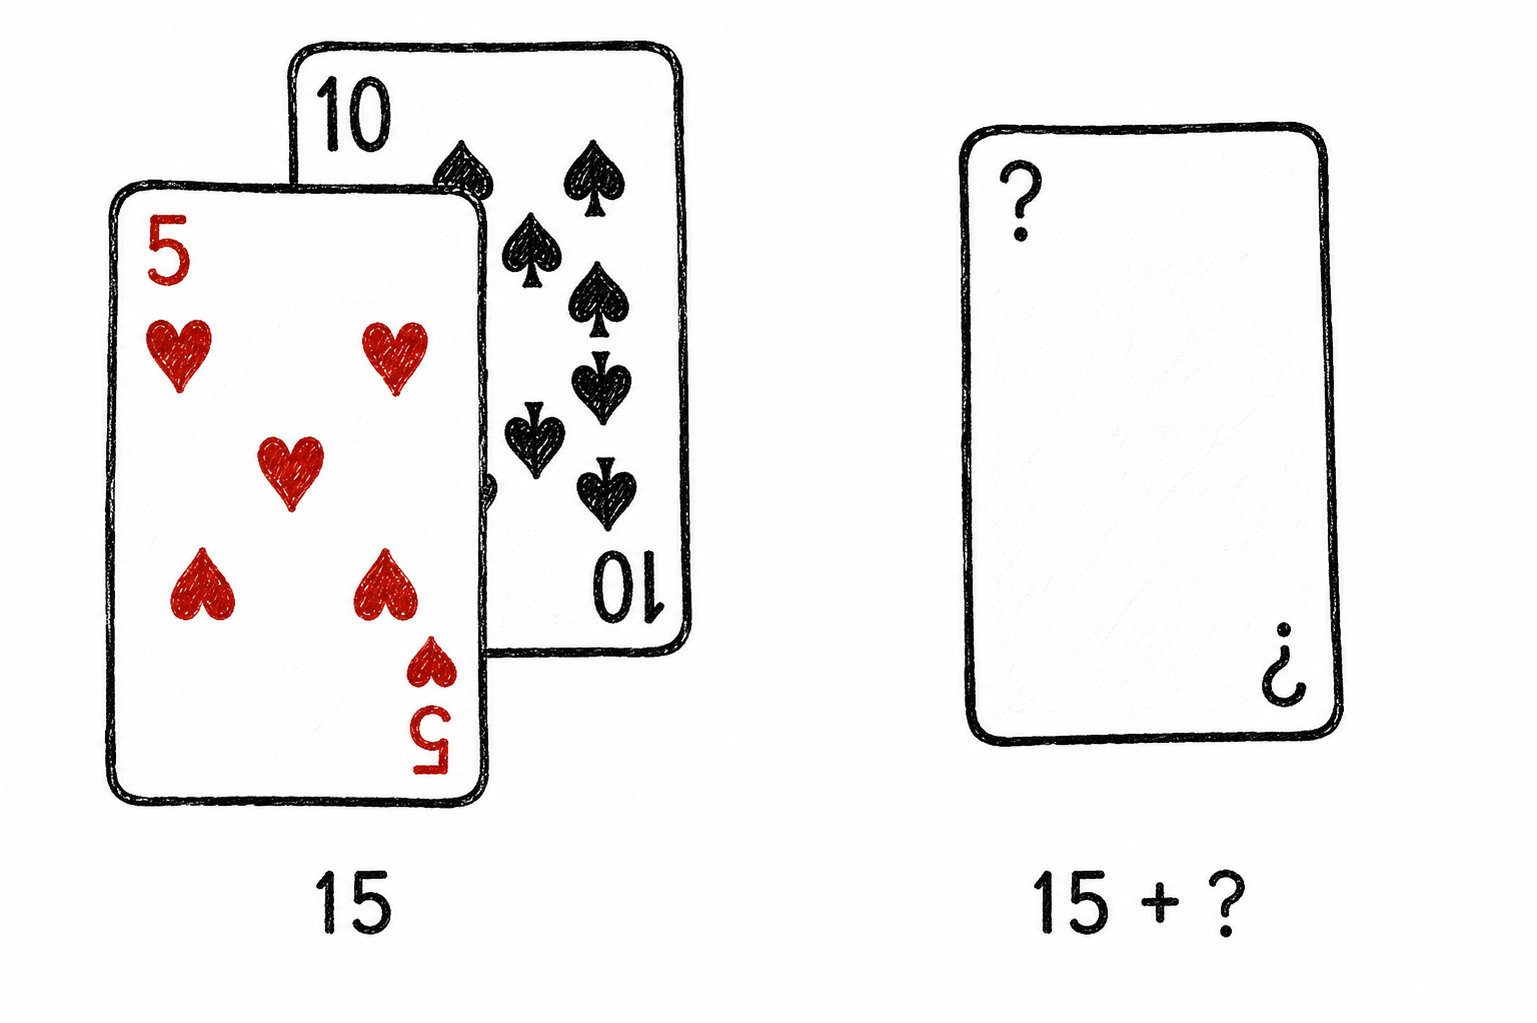
| Next card | Resulting score |
|---|---|
| 8 | 23 |
| J | 25 |
| 4 | 19 |
| 6 | 21 |
| A | 16 |
| ... | ... |
After repeating the experiment many times, group each row in the list above by the resulting score and obtain the number of times we ended up with each score. This is what the grouped list can look like after running the experiment 100 times. Your results might vary slightly but the overall distribution should not be far off.
| Next card | Resulting score | Occurrences |
|---|---|---|
| A | 16 | 9 |
| 2 | 17 | 8 |
| 3 | 18 | 7 |
| 4 | 19 | 5 |
| 5 | 20 | 8 |
| 6 | 21 | 7 |
| 10 - K | 22+ | 56 |
This table doesn't tell us what the next card will be but it gives us a good idea of what is likely to happen in this situation. 56 out of 100 times we will end up with a score of 22 or higher, immediately losing the game. And 9 out of 100 times we will end up with a score of 16, insufficient to beat the dealer. In other words, drawing a card with a 15 will lead to a bad outcome in 56 + 9 = 65 out of 100 times. We still don't know what the next card will be but, in absence of other information, drawing a card seems like a risky move.
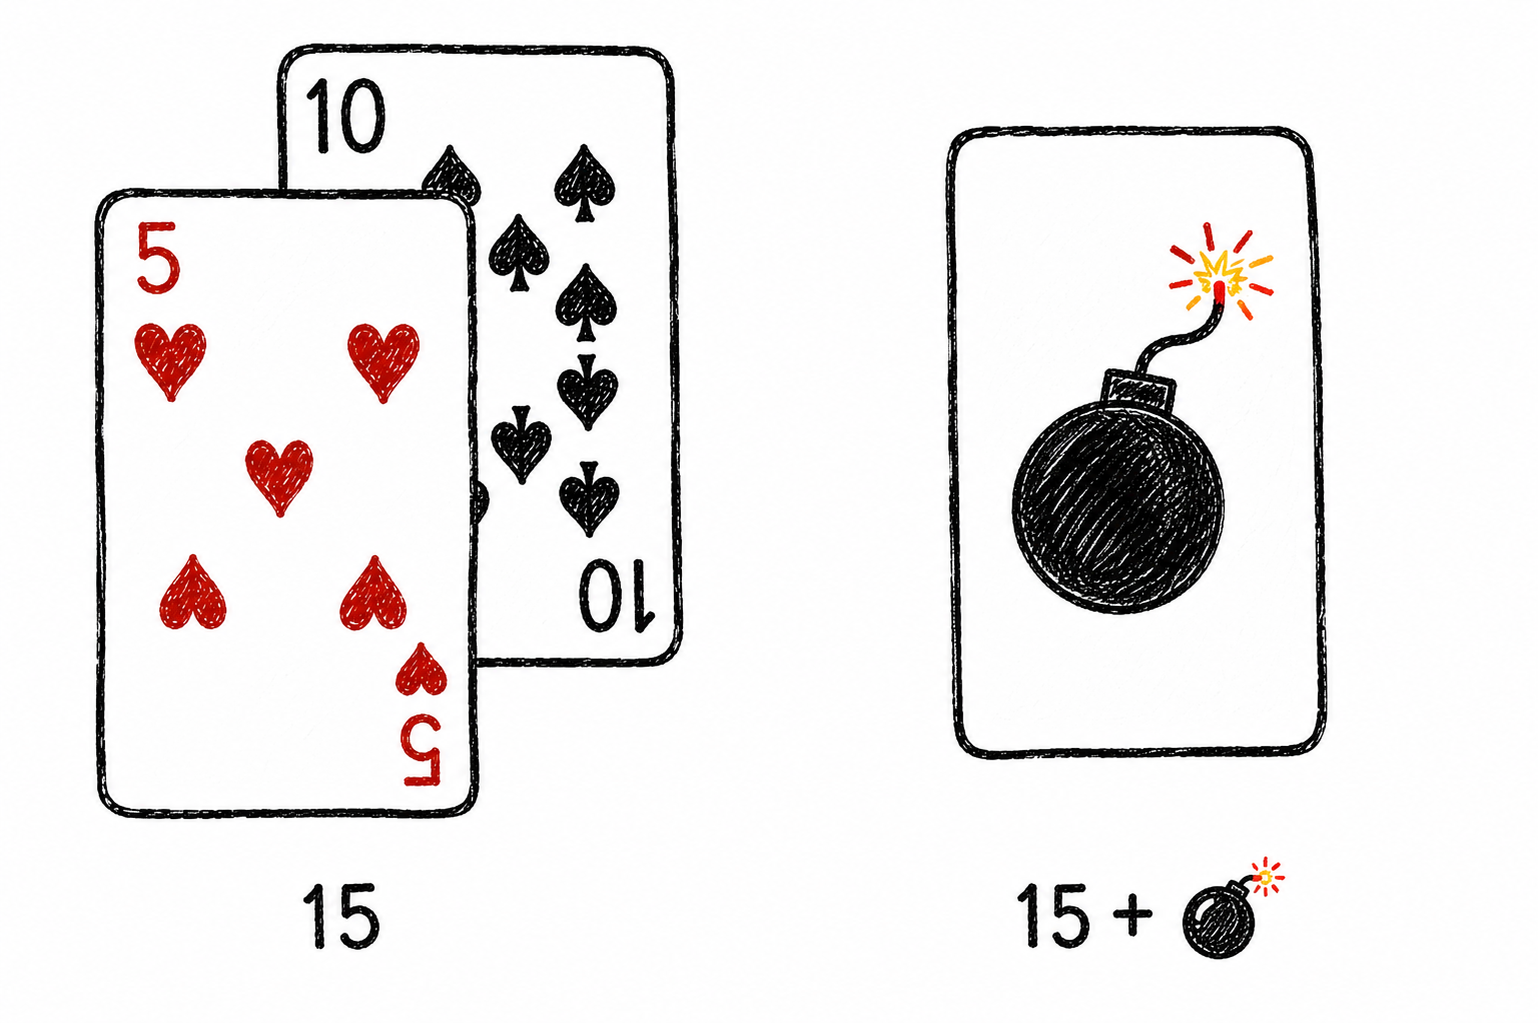
This empirical approach is perfectly valid but it has some limitations. On the one hand, we are using one deck only instead of the 6-8 decks casinos use. And the way we shuffle the cards is probably different from the way dealers or electronic shufflers do. These variations might seem irrelevant but they can lead to significant differences in the long run.
On the other hand, the results will only be accurate if we repeat the experiment a large number of times. By running the experiment 100 times we might get an unlikely distribution of cards which will not be representative of the results in the long run. To cancel out the chance of unlikely distributions, we would have to run the experiment many more times. Doable, but slow.
Statistical analysis
Fortunately there is a more practical way of computing the table above. One that is not affected by the way we shuffle the cards nor the number of times we run the experiments. We know that each deck of cards contains 52 cards, grouped in 4 identical sets of 13 cards. Dividing the number of cards with the same symbol among the total number of cards, we find the likelihood of drawing a card with that symbol. There are 4 aces in a deck of 52 cards, therefore we can expect to draw an ace 4 out of 52 times. Expressed as a percentage, that is 4/52 = 1/13 = 0.0769 = 7.69%.
And that's how we end up getting to probability and statistics. Two rather unpopular disciplines which turn out to be useful tools for analyzing Blackjack. From now on we will use some statistical methods to analyze the game. However, aware of the reluctance they arouse, we will use the minimum necessary. As Antoine de Saint-Exupéry said: "Perfection is achieved, not when there is nothing more to add, but when there is nothing left to take away".
There are two different ways of computing the table above using statistics.
Ignoring the cards that have been played. The results are less precise but the computation is simpler and does not depend on the number of decks used by the casino. When using this option we assume there is an infinite stream of cards and the probability of drawing a card always remains the same. This is not the case in reality but it is a good enough approximation for our purposes.
This option is called independent probability model. These are the probabilities of next drawing each card for a 10,5 hand:
Next card Resulting score Cards Probability A 16 4/52 7.69% 2 17 4/52 7.69% 3 18 4/52 7.69% 4 19 4/52 7.69% 5 20 4/52 7.69% 6 21 4/52 7.69% 10 - K 22+ 28/52 53.85% Considering the cards that have been played. The results are more precise but the computation is more complex and depends on the number of decks used by the casino. When using this option we need to adjust the probabilities to exclude the cards that have been dealt already.
In the example above, a 10 card and a 5 card have been dealt already. That means there are only 3 more 10 cards and 3 more 5 cards left in the deck. It also means there are 50 cards left in the deck instead of 52. Therefore, the probability of drawing a 10 or a 5 is not 4/52 but 3/50. Similarly, the probability of drawing any other card, say an ace, is 4/50.
This option is called dependent probability model. These are the probabilities of next drawing each card for a 10,5 hand:
Next card Resulting score Cards Probability A 16 4/50 8% 2 17 4/50 8% 3 18 4/50 8% 4 19 4/50 8% 5 20 3/50 6% 6 21 4/50 8% 10 - K 22+ 27/50 54% The probabilities are more accurate. And they get even more accurate by considering 8 decks instead of 1:
Next card Resulting score Cards Probability A 16 32/414 7.73% 2 17 32/414 7.73% 3 18 32/414 7.73% 4 19 32/414 7.73% 5 20 31/414 7.49% 6 21 32/414 7.73% 10 - K 22+ 223/414 53.86%
As you can see, the difference in probabilities between the two models when using 8 decks is ridiculously small. Since the dependent probability model is more complex and it does not give us a significant gain, I will be using the independent probability model in future chapters of this series.
This is how probability and statistics help us making solid decisions in Blackjack. Now that we have set the foundations we can move on to more exciting ventures, such as forecasting the final scores. Let's recap the key points so far:
- Making decisions is difficult because we need to guess the next card
- Keeping track of the cards that have been dealt can help us guessing the next card but it is difficult
- Simulations give us an idea of what the next card can be, but they have limitations
- Statistics give us an idea of what the next card can be without the need to run simulations. The numbers are not perfect but they are accurate enough
Posts timeline