A key aspect that makes Blackjack decision-making difficult is the fact that we always play our hand before the dealer does. It almost feels like bidding in a secret auction, where, without knowing how much our rival will bid, we need to place a bid high enough to win. Except that our rival does know how much we are bidding. This is called the last mover advantage.
To make up for that advantage, the dealer plays with a fixed strategy that is known to the player: they must stand on 17 and draw to 16. That limits the dealer's advantage and creates a certain sense of fairness. We don't know what the dealer's final score will be, but we can tell that they will either bust or end with a score in the range 17-21. That gives us an idea of the score we need to beat. But there is more.
It turns out we can exploit the dealer's strategy to forecast how often they will bust and how often they will end with each score in their range. This will not help us making better decisions yet, but it will allows us to predict the earnings of our decision making in the long run. To forecast the dealer's final score, we need a combination of two things.
The first thing is a list of all the possible hands the dealer can end up with. Generating such a list requires simulating every possible scenario the dealer can go through, and writing down every hand with score of 17 or higher. It is a time-consuming and error prone exercise but, fortunately, computers are very good at completing these sort of tasks.
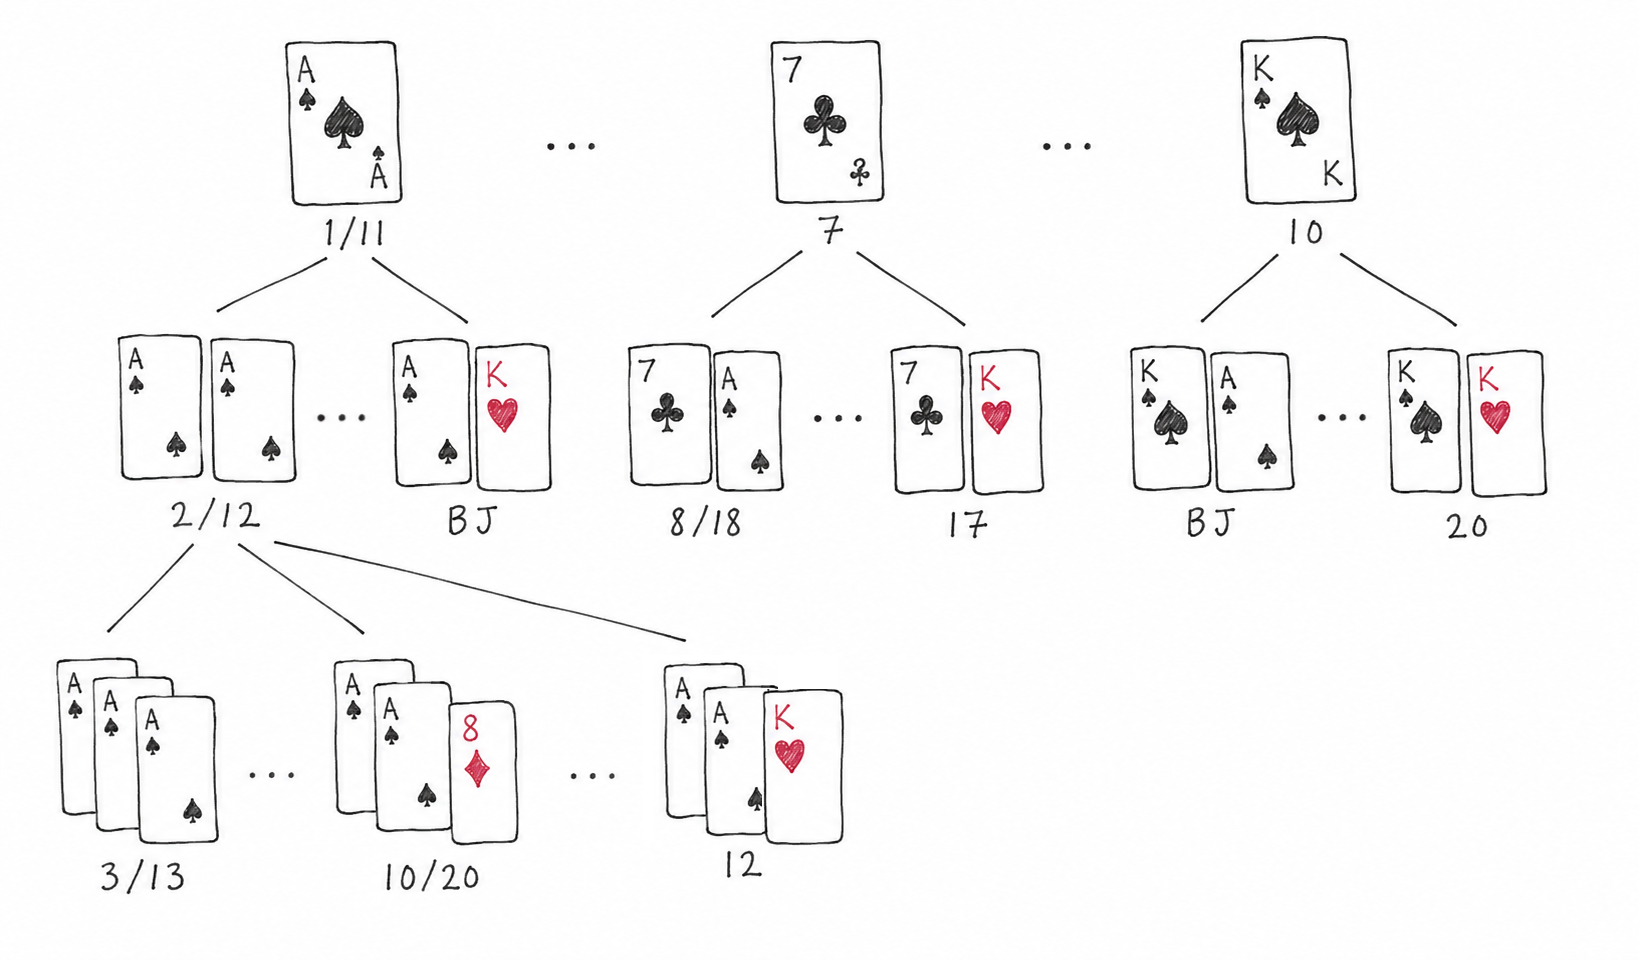
- If the 1st card is A and the 2nd card is A, the score is 2/12. The dealer draws a 3rd card. Simulation continues
- If the 1st card is A, the 2nd card is A and the 3rd card is A, the score is 3/13. The dealer draws a 4th card. Simulation continues
- ...
- If the 1st card is A, the 2nd card is A and the 3rd card is 8, the score is 10/20. The dealer stops drawing. We write down the hand and skip further simulation from this hand
- ...
- If the 1st card is A, the 2nd card is A and the 3rd card is a K, the score is 12. The dealer draws a 4th card. Simulation continues
- ...
- If the 1st card is A and the 2nd card is K, the score is blackjack. The dealer stops drawing. We write down the hand and skip further simulation from this hand
- ...
The second thing we need is the probability of the dealer ending up with each hand in the list. In chapter 1 I introduced the independent probability model and defined the probability of drawing a certain card as 1 out of 13, regardless of the cards that have been dealt before. Using that model, the probability of a certain combination of cards is obtained by multiplying the probability of each card in the combination. A few examples:
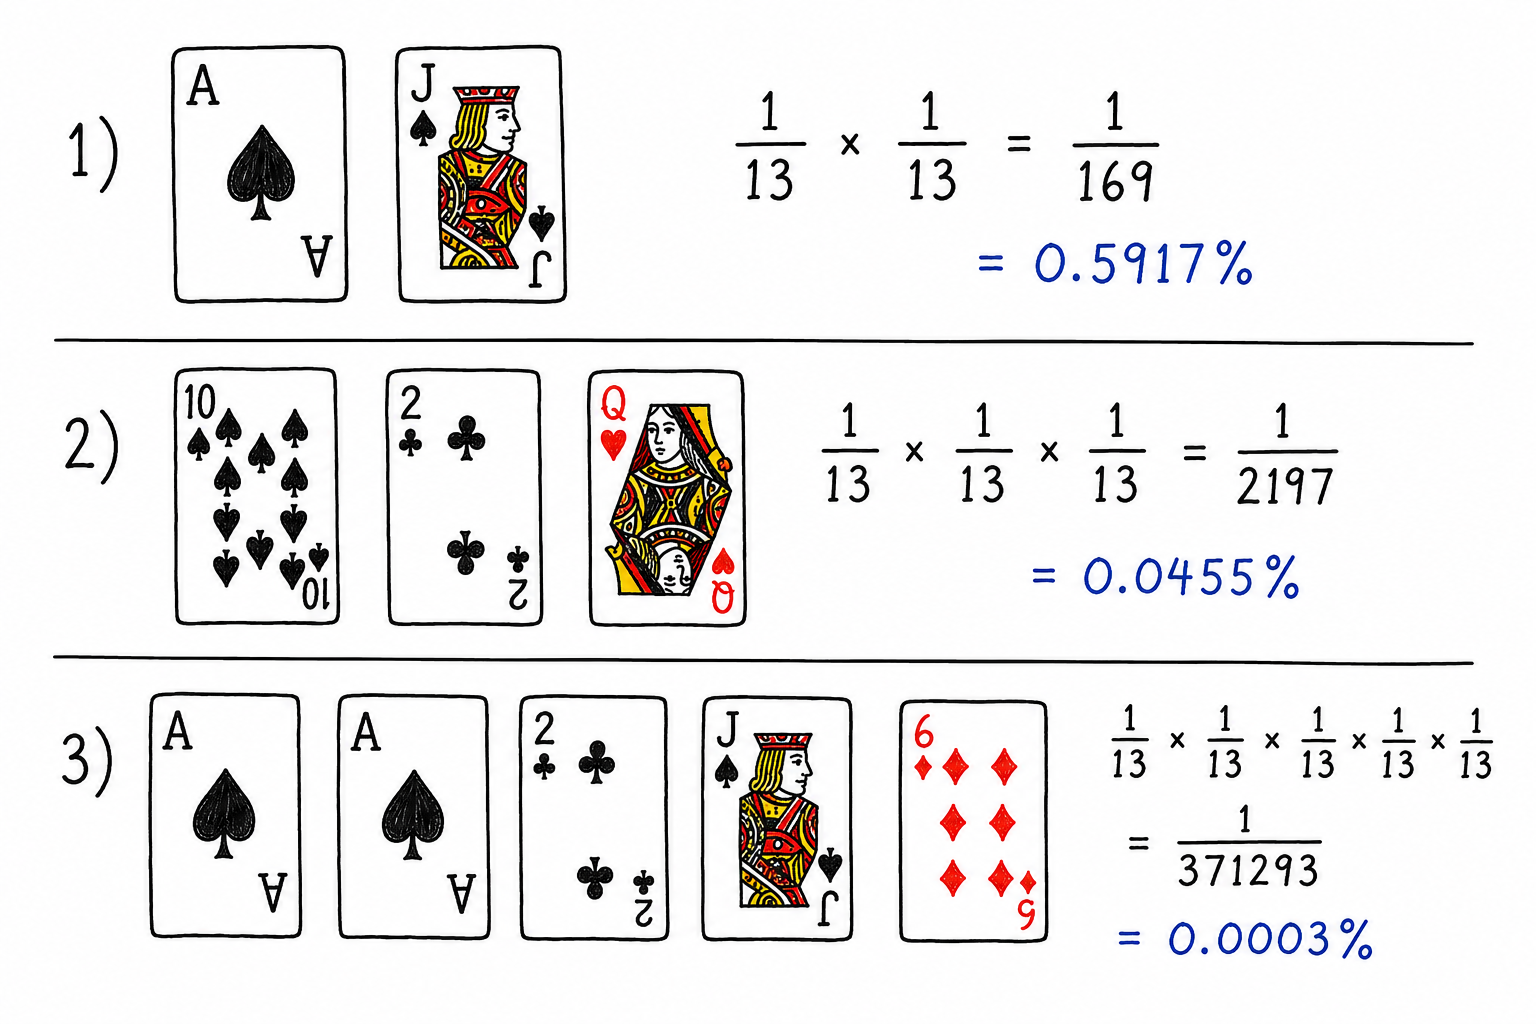
These probabilities tell us that the dealer will end with cards A,J (in that particular order) in 1 out of 169 times, and will only end with cards A,A,2,J,6 in 1 out of 371293 times. The numbers make sense: the first scenario is far more likely than the second. Using this method we can obtain the probability of each combination in the list of the dealer's final hands:
| Cards | Score | Probability |
|---|---|---|
| A, A, A, A, A, A, A | 7/17 | 0.00000159% |
| A, A, A, A, A, A, 2 | 8/18 | 0.00000159% |
| … | … | … |
| A, A, K, A, 2, K | Bust | 0.0000207% |
| … | … | … |
| A, 2, 3, 2 | 8/18 | 0.0035% |
| … | … | … |
| 4, 2, 4, 3, 2, 10 | Bust | 0.0000207% |
| … | … | … |
| 8, 9 | 17 | 0.59% |
| … | … | … |
| K, K | 20 | 0.59% |
The list of possible final hands contains 79489 elements and it is too long to write it down here in its entirety. See https://capelski.github.io/blackjack-stats/en/threshold/hands for the full list of hands if you are curious about it.
Having both things we can now find out the probability of the dealer ending the game with a specific score. We do so by grouping hands by final score. For example, the hands "A, A, A, A, A, A, A" and "8, 9" will be part of the group with score 17. The hands "A, A, A, A, A, A, 2" and "A, 2, 3, 2" will be part of the group with score 18. The hands "A, A, K, A, 2, K" and "4, 2, 4, 3, 2, 10" will be part of the bust group. And so on.
Once all the hands have been placed in a group, we sum the probability of all the hands in the same group. This is what the list looks like after grouping the hands by final score and summing their probabilities.
| Score | Hands | Probability |
|---|---|---|
| 17 | 6640 | 14.51% |
| 18 | 6650 | 13.95% |
| 19 | 6666 | 13.35% |
| 20 | 6701 | 18.03% |
| 21 | 6726 | 7.27% |
| BJ | 8 | 4.73% |
| 22+ | 46098 | 28.16% |
| Total | 79489 | 100.00% |
Source: https://capelski.github.io/blackjack-stats/en/threshold/scores
Based on that list we can expect the dealer to end with a score of 20 points in 18 out of 100 times. We can also expect the dealer to bust in 28 out of 100 times, or in 1 hand out of every 4 approximately. Isn't it impressive what some basic statistics can tell us about the dealer's results?
In fact, this approach is not limited to the dealer. We can use the same method to find the expected final scores of any player with a defined strategy. These are the expected final scores for a common player strategy: drawing to 14 and standing on 15. In the next chapter, we will use these final scores to predict the expected earnings of a given strategy.
| Score | Hands | Probability |
|---|---|---|
| 15 | 1310 | 13.29% |
| 16 | 1314 | 12.80% |
| 17 | 1320 | 12.27% |
| 18 | 1330 | 11.71% |
| 19 | 1346 | 11.11% |
| 20 | 1381 | 15.78% |
| 21 | 1406 | 5.03% |
| BJ | 8 | 4.73% |
| 22+ | 6234 | 13.28% |
| Total | 15649 | 100.00% |
Source: https://capelski.github.io/blackjack-stats/en/threshold/scores?t=15
The "Stand on 15" strategy feels intuitive because 15 is the lowest score where the probability of busting by drawing a card is bigger than 50%. Using the independent probability model, the risk of busting with a score of 15 equals 7 cards (7, 8, 9, 10, J, Q, K) out of 13, or 53.85%. This means that, by drawing a card, we bust more often than we manage to improve our score. This therefore feels like a natural point to stop drawing cards.
Posts timeline