Above all things, Blackjack is about making money. Our decision making is only as good as the money it makes us. To make sure we are making the right decisions, we need to understand how those decisions affect our earnings in the long run. In this chapter we will be trying to predict the earnings we can expect based on the decisions we make.
Let's start with an example. Imagine a cautious player who draws to 14 and stands on 15, never doubling or splitting. They start playing with a pot of 100€, betting 10€ per round and they play 100 rounds. Let's say they are not particularly lucky and they get about 37 wins, 5 blackjacks, 8 pushes and 50 losses (those are not random numbers; we will see where they come from later on). At the end of the 100 rounds their pot will have varied this much:
| Wins | 37 | +10€ | +370€ |
|---|---|---|---|
| Blackjacks | 5 | +15€ | +75€ |
| Pushes | 8 | 0€ | +0€ |
| Losses | 50 | -10€ | -500€ |
| Total | -55€ |
That is losing 55€ over the course of 100 bets. Quite a disappointing outcome. Is there any way we could have predicted that outcome before starting to play? Let's see how close to it we can get. We know the player's strategy: "Stand on 15". With that we can obtain their expected final scores, using the method we described in chapter 2.
| Score | Probability |
|---|---|
| 15 | 13.29% |
| 16 | 12.80% |
| 17 | 12.27% |
| 18 | 11.71% |
| 19 | 11.11% |
| 20 | 15.78% |
| 21 | 5.03% |
| BJ | 4.73% |
| 22+ | 13.28% |
Source: https://capelski.github.io/blackjack-stats/en/threshold/scores?t=15
Since we know the expected final scores of the dealer as well, we can cross the two sets of final scores to find out how often the player can expect to win, push or lose. Crossing final scores consists in creating a scenario for each possible player final score and each possible dealer final score. Since each scenario is defined by the two scores, we can tell the outcome of the game for each scenario. For example, when the player has a score of 15 and the dealer has a score of 17, the player loses. When the player has a score of 20 and the dealer has a score of 18, the player wins. And so on. Here is the matrix of scenarios for the "Stand on 15" strategy.
| 17 | 18 | 19 | 20 | 21 | BJ | 22+ | |
|---|---|---|---|---|---|---|---|
| 15 | 🔴 | 🔴 | 🔴 | 🔴 | 🔴 | 🔴 | 🟢 |
| 16 | 🔴 | 🔴 | 🔴 | 🔴 | 🔴 | 🔴 | 🟢 |
| 17 | 🟡 | 🔴 | 🔴 | 🔴 | 🔴 | 🔴 | 🟢 |
| 18 | 🟢 | 🟡 | 🔴 | 🔴 | 🔴 | 🔴 | 🟢 |
| 19 | 🟢 | 🟢 | 🟡 | 🔴 | 🔴 | 🔴 | 🟢 |
| 20 | 🟢 | 🟢 | 🟢 | 🟡 | 🔴 | 🔴 | 🟢 |
| 21 | 🟢 | 🟢 | 🟢 | 🟢 | 🟡 | 🔴 | 🟢 |
| BJ | 🟢 | 🟢 | 🟢 | 🟢 | 🟢 | 🟡 | 🟢 |
| 22+ | 🔴 | 🔴 | 🔴 | 🔴 | 🔴 | 🔴 | 🔴 |
Source: https://capelski.github.io/blackjack-stats/en/threshold/comparisons/matrix?t=15&mm=result
And there is more. We know the probability of each final score, for both the player and the dealer. We can compute the probability of each scenario, by multiplying the probability of the player ending with score X and the probability of the dealer ending with score Y. We expect the player to end with a score of, for example, 17 in 12.27% of the games. We also expect the dealer to end with a score of 17 in 14.51% of the games. Therefore, we expect both the player and the dealer to push with a score of 17 in 12.27% x 14.51% = 1.78% of the games. Computing the probability for all the scenarios draws the following table.
| 17 | 18 | 19 | 20 | 21 | BJ | 22+ | Total | |
|---|---|---|---|---|---|---|---|---|
| 15 | 1.93% | 1.85% | 1.77% | 2.40% | 0.97% | 0.63% | 3.74% | 13.29% |
| 16 | 1.86% | 1.79% | 1.71% | 2.31% | 0.93% | 0.61% | 3.60% | 12.80% |
| 17 | 1.78% | 1.71% | 1.64% | 2.21% | 0.89% | 0.58% | 3.46% | 12.27% |
| 18 | 1.70% | 1.63% | 1.56% | 2.11% | 0.85% | 0.55% | 3.30% | 11.71% |
| 19 | 1.61% | 1.55% | 1.48% | 2.00% | 0.81% | 0.53% | 3.13% | 11.11% |
| 20 | 2.29% | 2.20% | 2.11% | 2.85% | 1.15% | 0.75% | 4.44% | 15.78% |
| 21 | 0.73% | 0.70% | 0.67% | 0.91% | 0.37% | 0.24% | 1.42% | 5.03% |
| BJ | 0.69% | 0.66% | 0.63% | 0.85% | 0.34% | 0.22% | 1.33% | 4.73% |
| 22+ | 1.93% | 1.85% | 1.77% | 2.39% | 0.97% | 0.63% | 3.74% | 13.28% |
| Total | 14.51% | 13.95% | 13.35% | 18.03% | 7.27% | 4.73% | 28.16% | 100% |
Source: https://capelski.github.io/blackjack-stats/en/threshold/comparisons/matrix?t=15
The probabilities of the dealer final scores don't change when analyzing a subset of player final scores. In other words, if the dealer ends with a score of 17 in 14.51% of all the games, they will also end with a score of 17 in 14.51% of the games where the player has a score of X. In statistics, this is called selection invariance.
This table is rather verbose. Anton Chekhov, a Russian playwright, said that if a gun appears in a story, it must be fired by the end of the story. We could establish a similar principle in statistics: if a table appears in a story, its data must be combined to produce one or more indicators by the end of the story. In this story, we will obtain such indicators by grouping the probabilities by outcome: wins, pushes and losses. Also, because Blackjack wins are paid higher, we will create a separate group for them.
- Wins = 3.74 + 3.60 + 3.46 + ... = 37.56%
- Blackjack wins = 0.69% + 0.66% + 0.63% + ... = 4.51%
- Pushes = 1.78% + 1.63% + 1.48% + ... = 8.33%
- Losses = 1.93% + 1.85% + 1.77% + ... = 49.60%
These grouped probabilities start drawing a picture for the "Stand on 15" strategy. A picture that tells us, for example, that the cautious player loses more often than they win. The picture doesn't convey how the higher number of losses affects our earnings over time however. Since it is earnings we are interested in, we will want to translate each outcome into earnings. A convenient way of doing so is by expressing the earnings of each outcome in terms of pot variation:
- Wins increase the pot by the bet amount. +1 bet
- Blackjack wins increase the pot by 3/2 times the bet amount. +3/2 bets
- Pushes don't affect the pot. +0 bets
- Losses decrease the pot by the bet amount. -1 bet
We know how often we expect to get each outcome, and we know how each outcome affects our pot. We can combine these two pieces of information to calculate our expected pot variation in the long run. For that, we will use a fixed bet size, so we can equate wins and losses. If we were to change the bet size as the game goes on we could no longer do so. The resulting number is an excellent indicator of the expected earnings of a strategy, and it is often called edge in the Blackjack community.
| Result | Bet multiplier | Probability | Pot variation |
|---|---|---|---|
| Wins | +1 bet | 37.56% | +37.56% bet |
| Blackjack wins | +3/2 bets | 4.51% | +6.76% bet |
| Pushes | +0 bets | 8.33% | +0 bet |
| Losses | -1 bet | 49.60% | -49.60% bet |
| Edge | -5.28% bet |
Source: https://capelski.github.io/blackjack-stats/en/threshold/results?t=15
The edge tells us the percentage of our bet size that we can expect to win or lose per round on average. If the edge is negative, the game favours the dealer and we can expect to lose money at the end of the day. Conversely, if the edge is positive, the game favours the player and we can expect to win money. The edge for the "Stand on 15" strategy tells us that, on average, we can expect our pot to decrease by 5.28% of the bet size per round.
Negative edge values give us an idea of how many rounds we can expect to play before running out of money. Given the initial pot expressed in terms of bets, we can find out how long it takes for the pot to reach 0. If we start playing with a pot of, for example, 10 bets and we know we lose 5.28% of our bet size per round, we can expect to run out of money after 10 bets / 0.0528 bets per round = 189.4 rounds.
The edge indicator helps us predict how much money we will win or lose in the long run. Let's go back to the example of the cautious player. We know they can expect to lose, on average, 5.28% of their bet size per round. Since they are betting 10€ per round, that is losing 0.528€ per round. After 100 rounds, they can expect to have lost 52.8€. The player actually lost 55€ in the example, so the prediction is quite close!
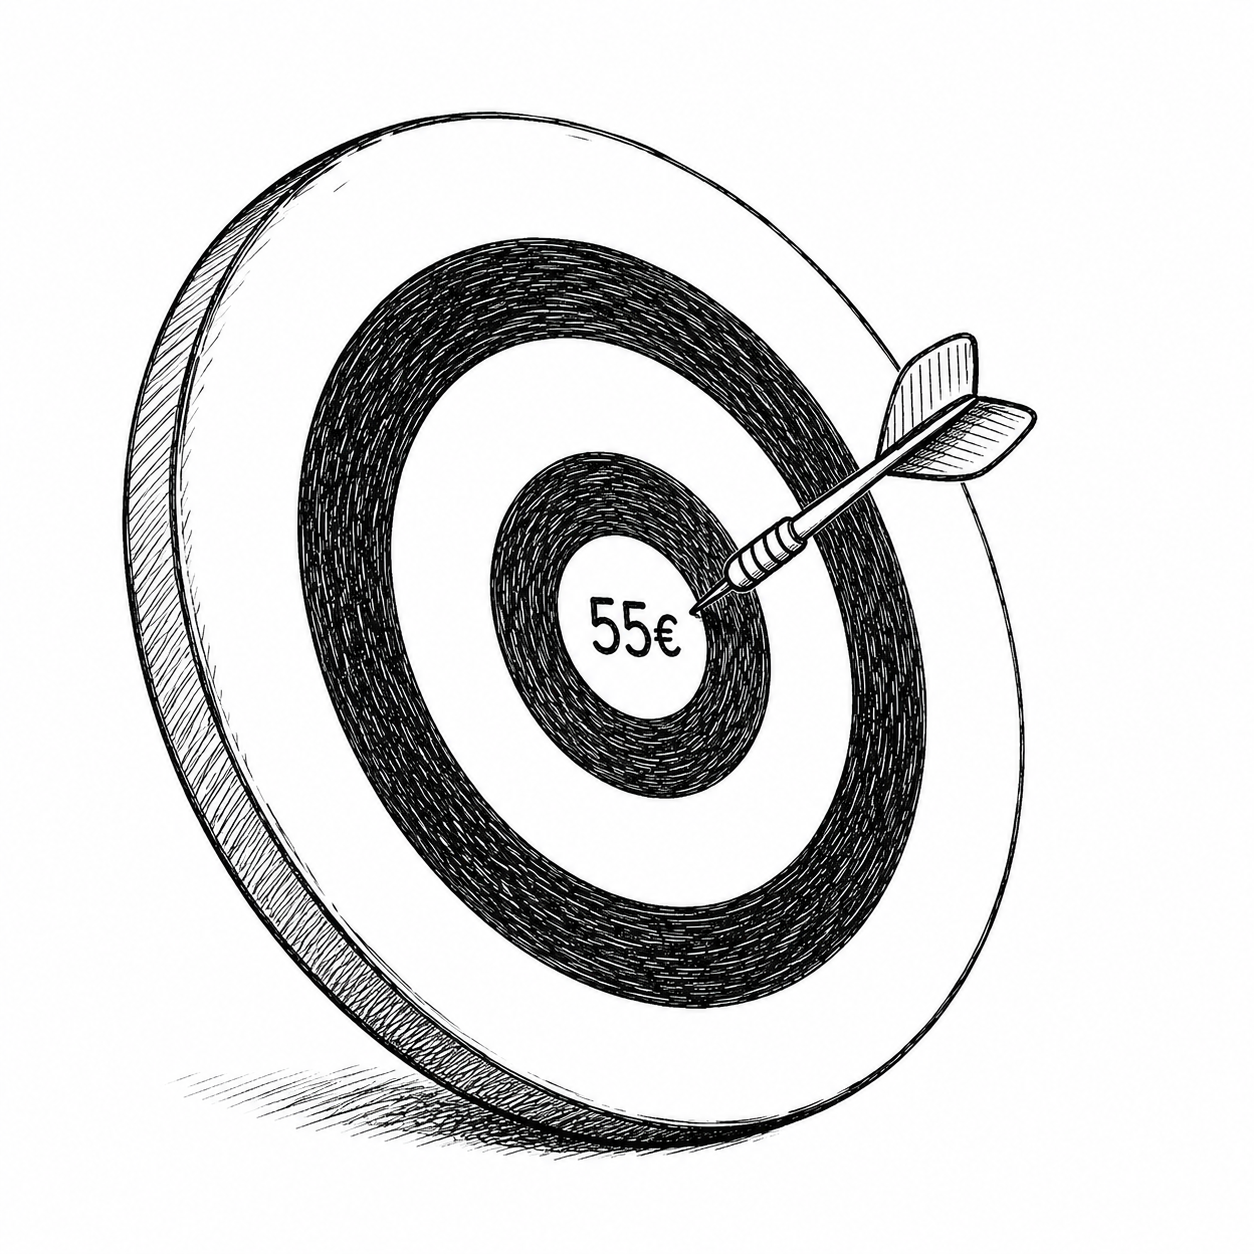
That is no coincidence, of course. I conveniently chose the number of wins, losses and pushes to be very close to the expected probabilities. 37.56% wins => 37 wins, 4.51% blackjack wins => 5 blackjacks, etc. If the player wins more rounds, the actual results will differ from the prediction. If the player wins less rounds, the actual results will also drift away from the prediction. Because, in the long run, the expected probabilities tend to hold true, we can assume the numbers I used will not be far off from the actual results.
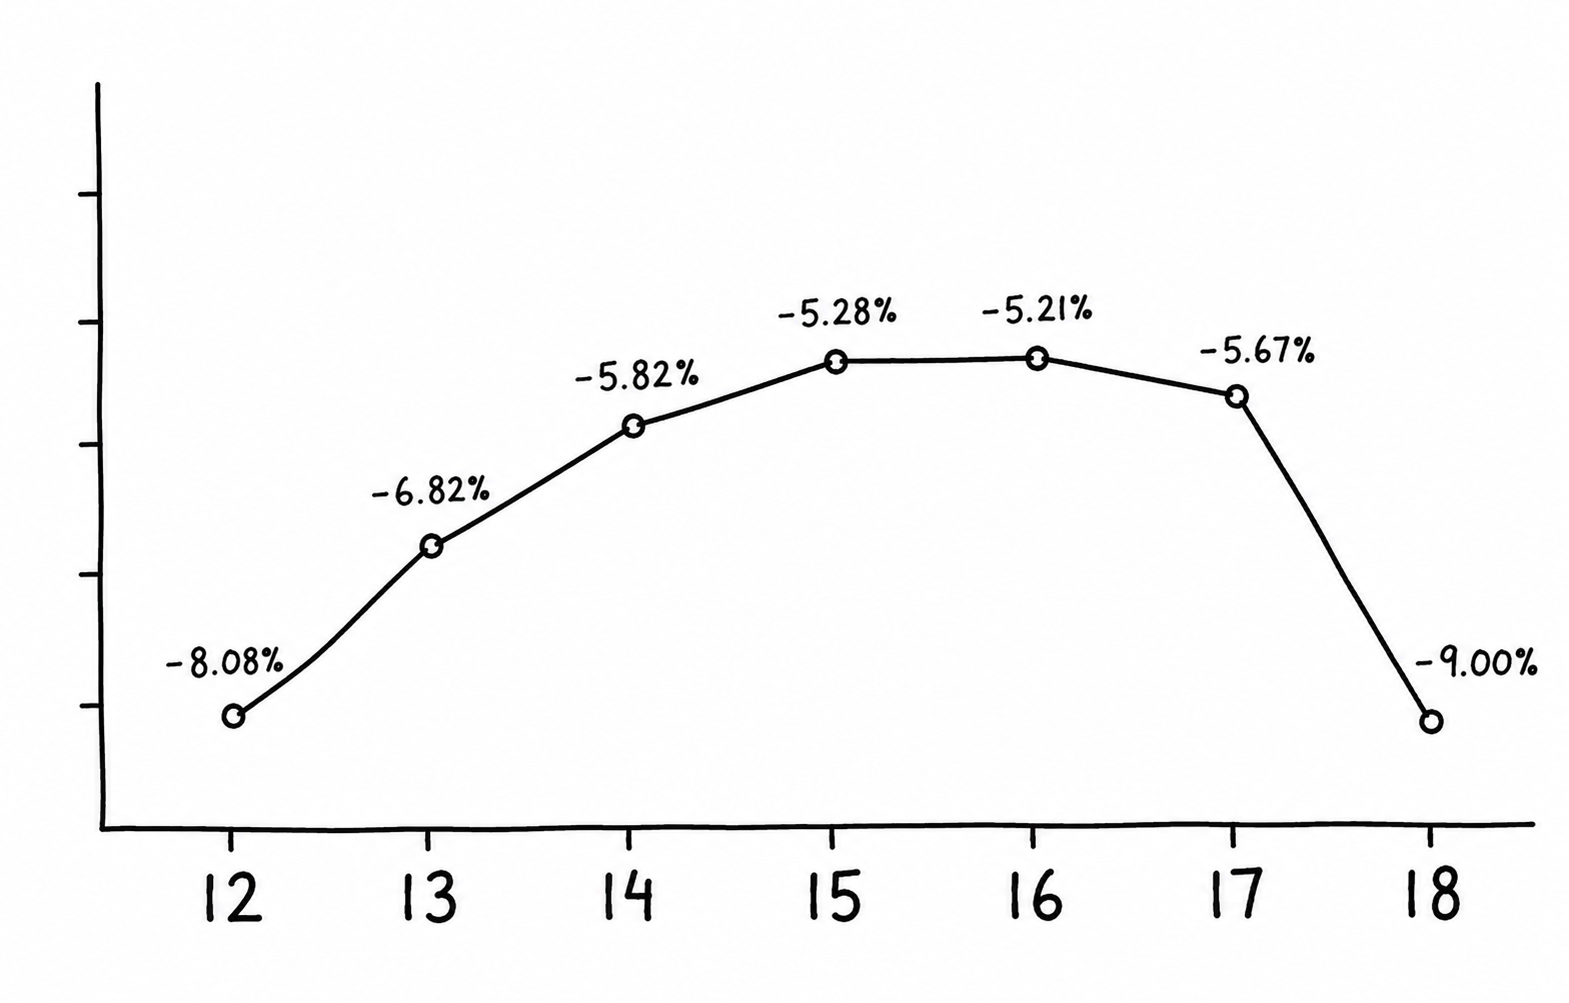
Finally, the edge indicator allows us to compare different strategies. Here are the indicators for different "Stand on X" strategies. The "Stand on 16" strategy is the one with the highest edge value and is therefore the most profitable one of them. In the next chapter we will be using the edge indicator to find out the optimal actions that yield the most earnings for every possible score.
| Strategy | Edge |
|---|---|
| Stand on 12 | -8.08% |
| Stand on 13 | -6.82% |
| Stand on 14 | -5.82% |
| Stand on 15 | -5.28% |
| Stand on 16 | -5.21% |
| Stand on 17 | -5.67% |
| Stand on 18 | -9.00% |
Posts timeline